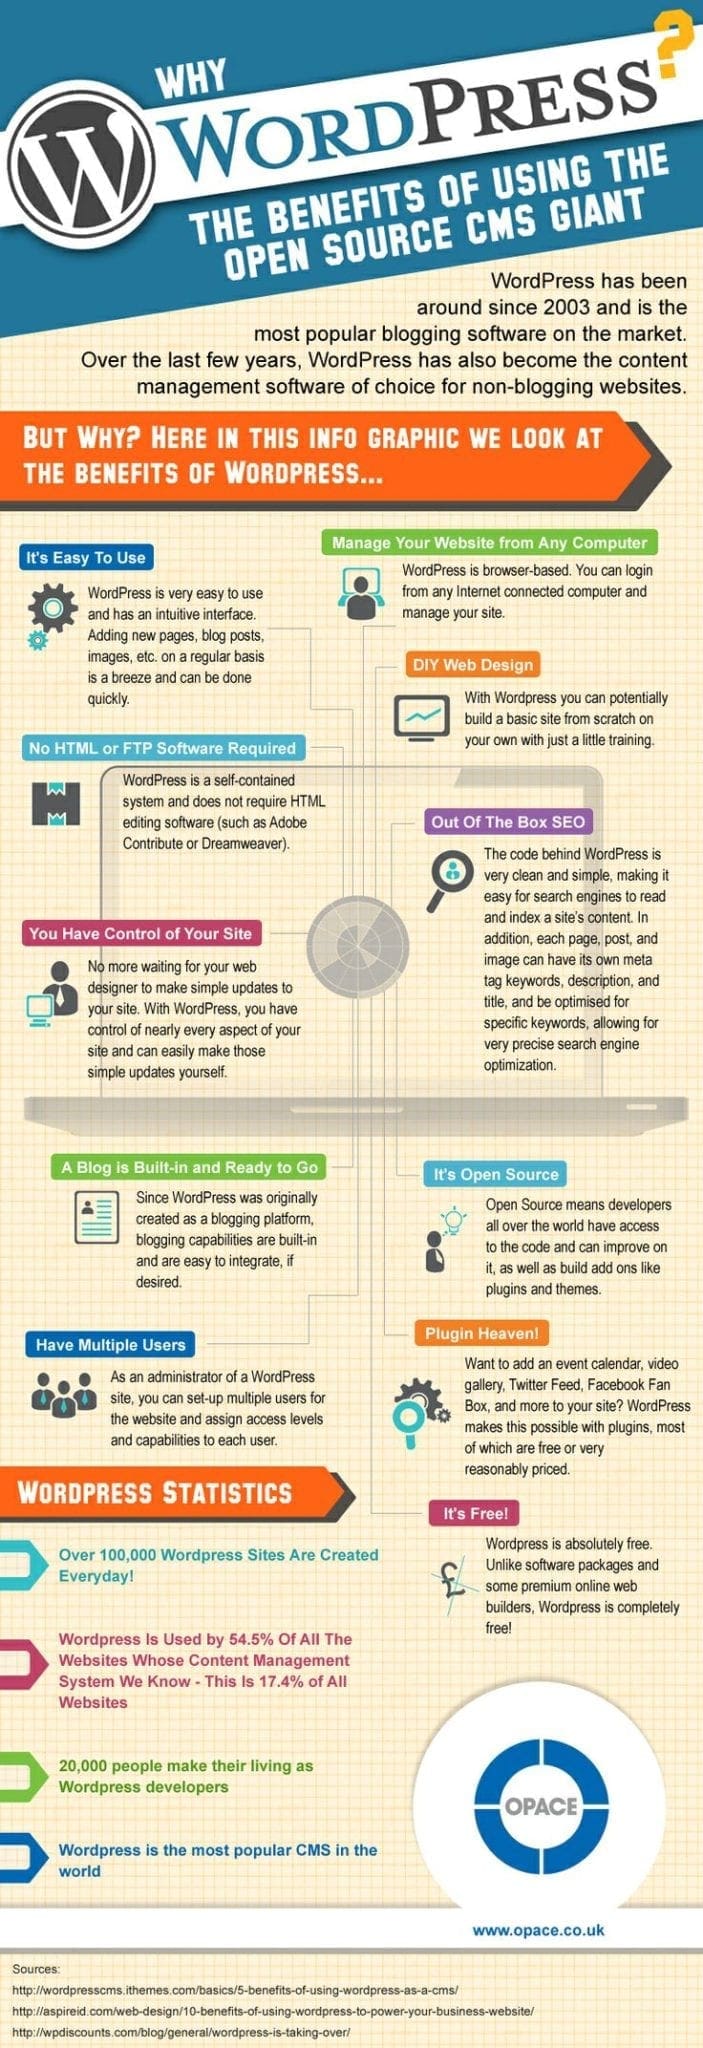
Benefits of Using WordPress for Business (Infographic)
Looking for the benefits of using WordPress for your business? Check out this infographic. Read more.
Explore our expert infographics articles, tutorials and in-depth guides.
7 articles in Infographics
About this category
Well-designed infographics turn complex data into visual stories that are easy to understand and share. Our articles cover infographic design principles, visual content strategy and how to create infographics that generate genuine engagement, social shares and valuable backlinks.
Infographics remain one of the most shareable content formats, making them a practical tool for link building, social reach and brand awareness. Our articles cover both the design process and the strategic thinking behind visual content that delivers results.
Looking for the benefits of using WordPress for your business? Check out this infographic. Read more.
Thinking of using Magento as your eCommerce platform? Find out if it's the best choice. Read more.

Curious about how virtual reality can benefit your business? Read more.
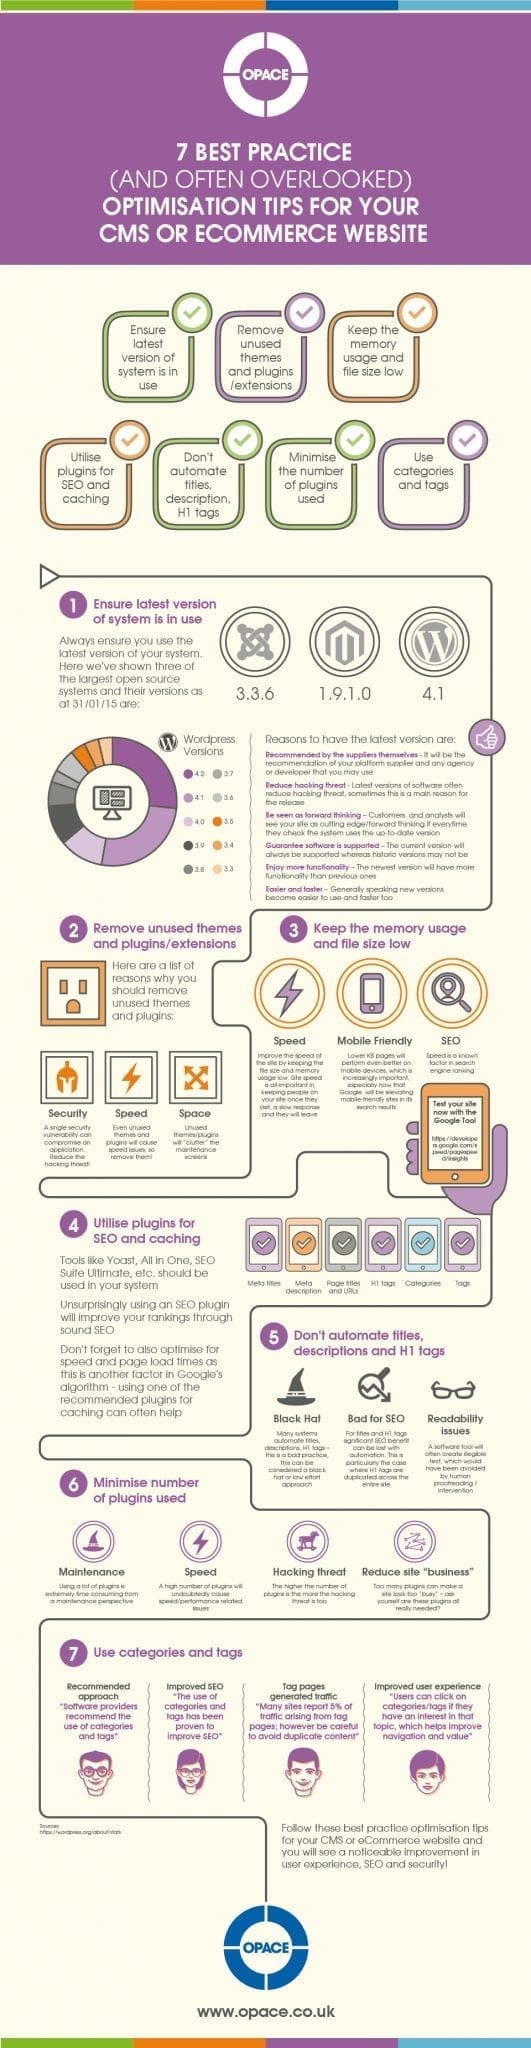
Searching for how to optimise your CMS for users and SEO? Are you happy with your website’s performance? Read more.
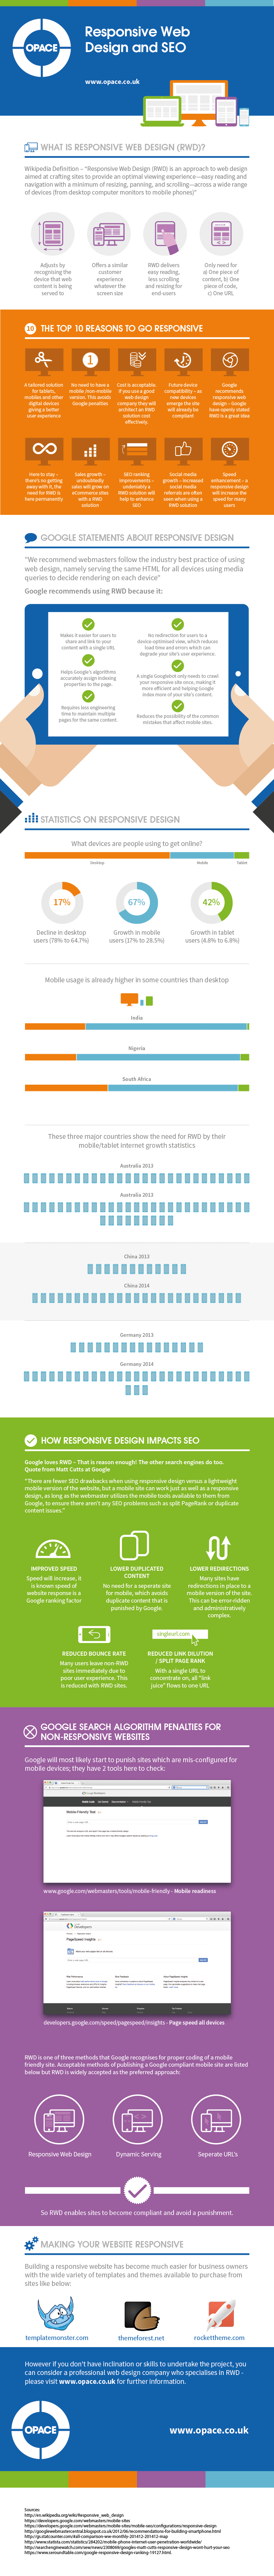
Responsive Web Design (RWD) is an approach to web design aimed at crafting sites to provide an optimal viewing experience—easy reading and navigation with a
![How to Overcome a Google Penguin Penalty [Infographic]](/images/wp-content/uploads/2015/01/Infographic-How-to-recover-from-a-Google-Penguin-Penalty-by-Opace.png)
Searching for how to overcome a Google Penguin penalty with positive SEO techniques? What is a Google Penguin Penalty? Read more.

Searching for how rich snippets can improve your eCommerce SEO? What are rich snippets? Read more.
From choosing the right infographic design tools to planning visual content campaigns, these articles help you create data-driven visual assets that serve a clear marketing purpose. We cover what makes a good infographic, how to promote them effectively and where they fit within a broader content strategy.
We have been designing infographics and publishing visual content guides for businesses since infographics first became a mainstream content marketing format. Our articles draw on experience creating data-driven visual assets across multiple industries.
Our infographic design guides cover design principles, data visualisation, tool recommendations, visual storytelling, infographic promotion strategies, using infographics for link building and how visual content fits into a broader content marketing and SEO strategy.
Yes. Well-designed infographics still outperform text-only content for social sharing and link acquisition. The key is creating visual content with original data or insights rather than repackaging commonly available information.
A clear data story, clean visual design, accurate information, logical flow and a balance between visual appeal and readability. The best infographics present complex information in an immediately understandable way.
Professional designers typically use Adobe Illustrator or Figma. For simpler work, Canva, Piktochart and Venngage offer template-based approaches. The tool matters less than the quality of the data, design and storytelling.
Infographics attract backlinks and social shares, both of which support SEO. They also improve engagement metrics on the pages where they are embedded and provide alt text opportunities for additional keyword relevance.
Get in Touch
We have 100% happy customers, so don't delay. Get in touch today and see how we can help.
SEND US A MESSAGE