Heatmapping Services
Uncover What Visitors Actually
Heatmapping & Session Recording - Uncover Hidden Friction Fast.
Watch, Analyse, Understand, Improve.
Heatmapping & Session Recording Services
Your Analytics Tell You What Happened — We Show You Why
Google Analytics tells you that 68% of visitors leave your product page without adding to basket. It tells you the bounce rate, the exit rate and the time on page. What it can't tell you is why. Did they scroll past the price? Did they try to click something that wasn't clickable? Did the CTA button sit below the fold on mobile? Heatmapping services and session recordings answer those questions. We overlay visual behaviour data onto your actual pages, showing exactly where visitors click, how far they scroll, what catches their attention and where they get stuck.
Our Birmingham-based analytics team uses tools including Hotjar, Microsoft Clarity and Mouseflow to capture and analyse real user sessions across the UK and international markets. We don't just install a tool and hand you a login. We systematically review thousands of session recordings, build click maps and scroll maps for key pages, identify friction patterns, tag rage clicks and dead clicks, and translate all of that into a prioritised action plan. The difference between having a heatmap tool and having heatmapping and session recording services is the interpretation. Raw data is useful. Expert analysis of that data is where conversion improvements come from. Our work feeds directly into conversion rate optimisation services and A/B testing services to validate improvements.
experience
Quick Navigation


STRATEGY WITHOUT
EXECUTION IS JUST NOISE
What our heatmapping and session recording services include
- Click and tap heatmapsVisual overlays showing where visitors click (desktop) and tap (mobile) on every page. Reveals whether users interact with the elements you expect and identifies clicks on non-interactive elements where visitors assumed functionality existed.
- Scroll maps and attention analysisShows how far visitors scroll down each page and where attention drops off. Critical for ensuring key content, CTAs and conversion elements are positioned where visitors actually see them.
- Session recordingsFull playback of individual visitor sessions showing mouse movement, scrolling, clicks, form interactions and navigation paths. We review recordings to identify common frustration patterns and usability blockers.
- Rage click and dead click detectionAutomated detection of visitors clicking repeatedly in frustration (rage clicks) or clicking on elements that do nothing (dead clicks). These signals flag usability problems that standard analytics completely miss.
- Form analyticsField-by-field analysis of form completion behaviour: which fields cause hesitation, which trigger abandonment and where error messages create confusion. Form friction is often the single biggest conversion killer on lead generation sites.
- Segment-based analysisFiltering behaviour data by traffic source, device type, new vs returning visitors and conversion status. Different segments behave differently, and the fixes needed for mobile users may not apply to desktop visitors.
TECHNOLOGIES & PLATFORMS
Digital Experience


Turning behavioural data into conversion improvements
Heatmaps and session recordings generate enormous volumes of data. The value is in turning that data into specific, actionable changes. Our analysis process starts with your conversion funnels. We identify the pages and steps with the highest drop-off rates from your SEO services and paid traffic, then focus behaviour analysis on those critical points. If 40% of visitors abandon your checkout at step 2, we watch session recordings of users at that step, build click maps to see what they interact with, and identify the specific friction causing abandonment.
From there, we build a prioritised recommendations list. Each recommendation links to specific evidence: "23% of mobile users rage-clicked the delivery cost section. Consider showing delivery costs earlier in the funnel." Recommendations feed directly into our A/B testing services where we validate changes before permanent implementation. This research-test-implement cycle is far more effective than making changes based on internal opinions or generic best-practice articles. The insights are specific to your visitors, on your site, with your content. That specificity is what produces conversion improvements that actually stick.


Why quantitative data alone is never enough
Analytics platforms show you aggregate numbers: page views, bounce rates, conversion rates, time on page. They answer "what" and "how many" but never "why." A page with a 75% bounce rate might have a content problem, a design problem, a speed problem or a targeting problem. Analytics can't distinguish between them. Behaviour analysis tools bridge that gap. Watching 50 session recordings of users bouncing from that page reveals whether they're scrolling past the content, clicking on non-functional elements, getting confused by the navigation or finding what they need and leaving satisfied.
That qualitative layer transforms analytics data from interesting statistics into actionable intelligence. It also protects against misinterpretation. A high exit rate from your pricing page might look like a problem in analytics. Session recordings might show that users are leaving to compare options and returning later to convert. Without that context, you'd "fix" a page that wasn't broken. Our user behaviour analysis team combines quantitative metrics with qualitative behaviour data to produce insights that are both statistically informed and grounded in real user context.
Sectors
We've Engineered Growth
Across Every Sector.
From bootstrap to boardroom, we've seen it all. And we make growth inevitable.
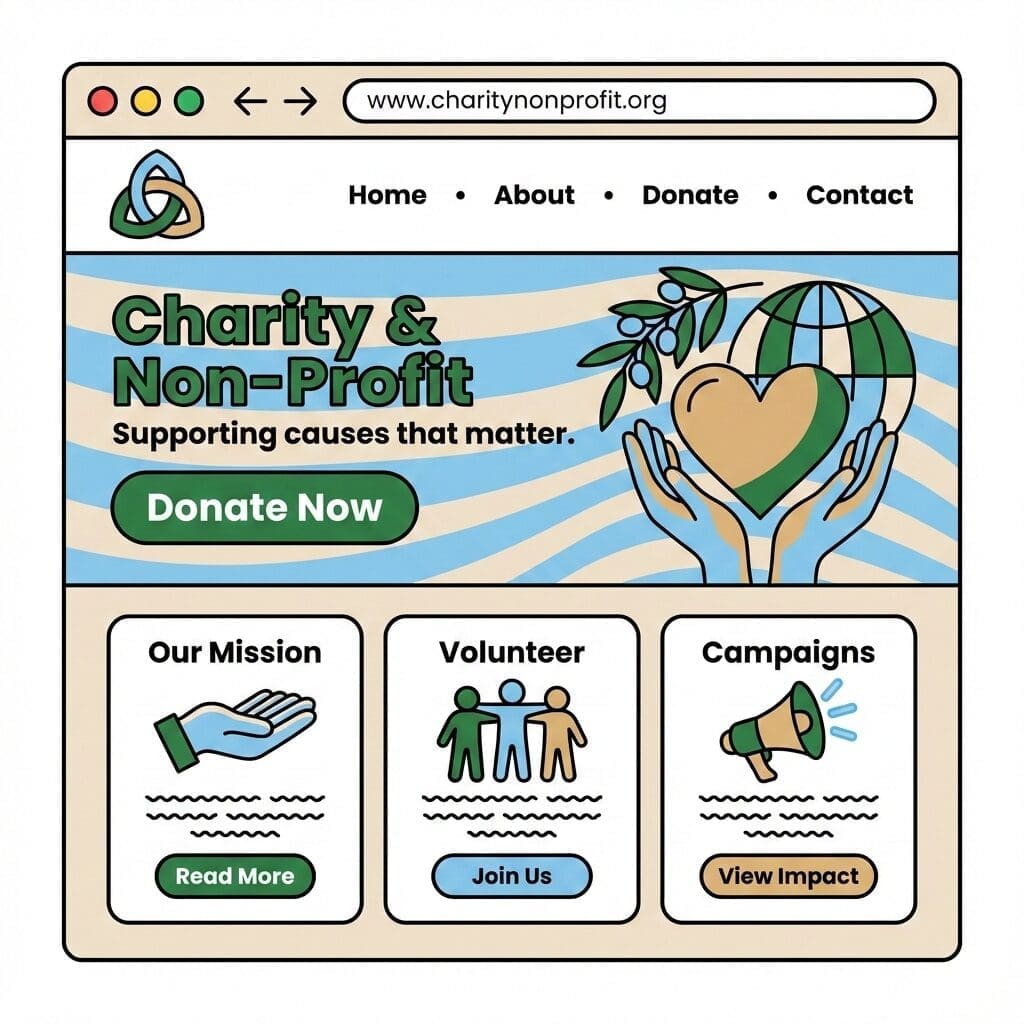
View All SectorsCharity & Non-Profit
Impactful, user-friendly websites that help charities and non-profits raise awareness and grow support.
Arts & Creative
Visually stunning portfolio sites that let artists, designers, and creatives showcase their work beautifully.

Engineering & Industrial
Specialised digital for engineering firms, manufacturing, and heavy industry.

IT & Technology
SEO, web design, and marketing for SaaS, IT services, and tech companies.

Healthcare & Medical
GDPR-compliant websites and patient-focused marketing for healthcare providers.

Financial Services
Trusted web design and marketing services for financial advisors and firms.

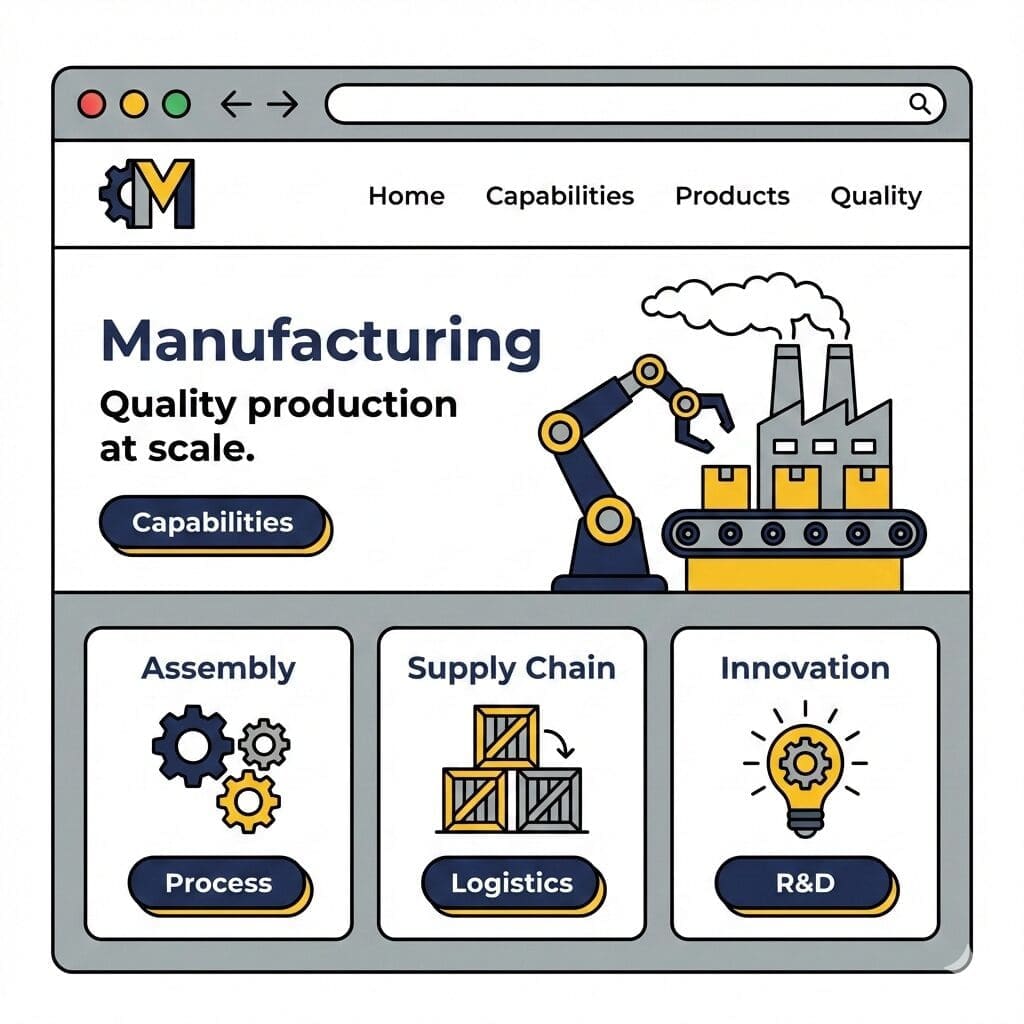
Manufacturing
Driving leads and visibility for UK manufacturers with targeted digital strategies.
Education & Schools
Engaging websites and visibility for schools, universities, and education providers.

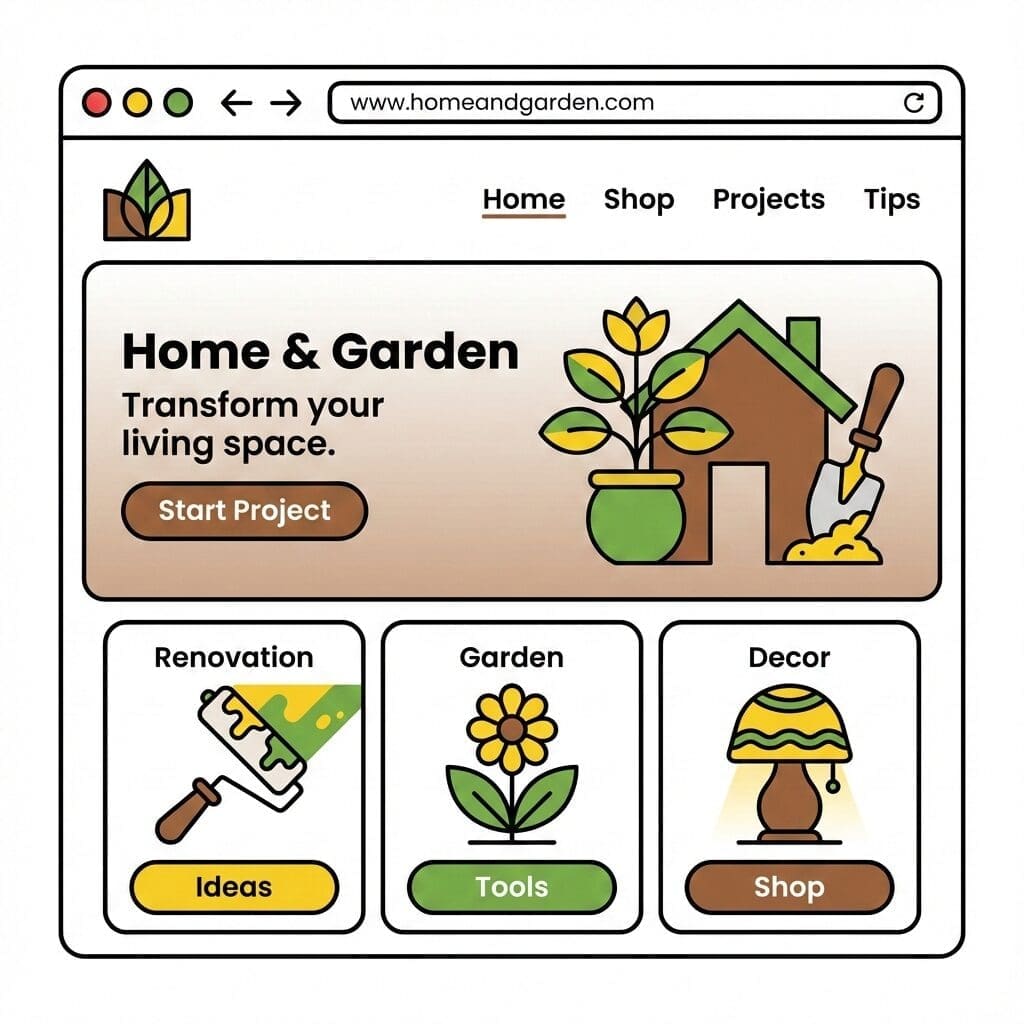
Home & Garden
Beautiful eCommerce and brochure websites for home, garden, and lifestyle brands.
Food & Beverage
Appetising websites and online marketing for restaurants, food brands, and hospitality.
Logistics & Transport
High-performance websites for logistics, haulage, and transport companies across the UK.
B2B & Professional Services
Websites and marketing services for consultancies, legal firms, and service providers.

SELECTED WORK
Clients First.
Always.
We work smartly and ethically to provide intelligent and cost-effective solutions that maximise your ROI and fuel business growth.


Reviews & Testimonials
See What Our Customers Say
Opace are rated 4.93/5 for Digital Marketing based on 75 customer reviews


Local, National & Global Brands
Organisations We've Worked With
SOME OF OUR AGENCY CERTIFICATIONS
Award Winning Digital Agency
We make sure our digital marketers and specialists are always up to speed. From Google to HubSpot and Semrush, we've completed many of the major certifications available.


HEATMAPPING & SESSION RECORDING
What Sets Our Behaviour Analysis Approach Apart
Any agency can install Hotjar and send you screenshots. What matters is what you do with the data.
We systematically review hundreds of sessions per funnel stage, tag friction patterns, cross-reference with analytics segments, and produce recommendations that are specific, prioritised and testable. It's the difference between having a tool and having a methodology.
Systematic session review
We don't skim 20 recordings and call it research. Our team reviews 200-500 sessions per funnel stage, tagging friction patterns and building a statistical picture of user behaviour that's far more reliable than anecdotal observation.
Analytics-integrated analysis
Behaviour data without analytics context is guesswork. We cross-reference heatmap and recording insights with GA4 funnel data, traffic source segments and conversion metrics to ensure recommendations address the right problems.
Privacy-first implementation
GDPR compliance is not optional. We configure all tools with proper data masking, cookie consent integration and recording rules that protect user privacy while still capturing the behaviour data needed for meaningful analysis.
Device-specific insights
Mobile users and desktop users navigate differently. We always segment analysis by device type and produce targeted recommendations for each. A fix that works on desktop may not apply to mobile, and vice versa.
Actionable output, not data dumps
Every piece of analysis produces a specific, testable recommendation linked to evidence. We highlight the recording timecodes, heatmap hotspots and analytics data that support each finding.
Testing integration
Insights without validation are still assumptions. Our behaviour analysis feeds directly into A/B testing programmes, ensuring recommendations are validated with controlled experiments before permanent implementation.
Why Choose Opace for Heatmapping & Session Recording?
If you're looking for more than a tool installation, these are the questions that help distinguish genuine behaviour analysis services from checkbox consultancy.
How is this different from just installing Hotjar ourselves?
Installing a tool gives you raw data. Without systematic review methodology, statistical tagging, analytics cross-referencing and prioritised action plans, most heatmap data goes unreviewed. We provide the expertise that turns data into conversion improvements.
What kind of issues do you typically find?
Common findings include CTAs below the fold on mobile, dead clicks on non-interactive elements, confusing navigation patterns, form fields causing abandonment, content that nobody scrolls to, and pricing pages that create anxiety rather than confidence.
Can you work alongside our existing analytics team?
Absolutely. We complement in-house analytics teams with specialist behaviour analysis expertise. We share our methodology, provide training on recording review techniques, and integrate findings with your existing reporting workflows.
How often should we review behaviour data?
For high-traffic sites, weekly review catches issues quickly. For most businesses, fortnightly or monthly analysis is sufficient. We recommend ongoing programmes rather than one-off audits, as user behaviour changes with traffic source, seasonality and site updates.
What reporting do we receive?
Monthly insight reports with annotated heatmap screenshots, key session recording clips, friction pattern analysis, prioritised recommendations ranked by impact, and progress tracking against previously identified issues.
Do you work with businesses outside Birmingham?
Yes. Our behaviour analysis team is Birmingham-based but we work with clients across the UK and internationally. All analysis is data-driven and delivered remotely. We've managed programmes for businesses in London, Manchester, Edinburgh and overseas.
How much do heatmapping and session recording services cost?
Our heatmapping and session recording services start from £500 per month for ongoing analysis and reporting. One-off audits are available from £1,500. Pricing depends on the number of pages analysed and the depth of session review required. Get in touch for a tailored quote.
What tools do you use for heatmapping?
We work with Hotjar, Microsoft Clarity, Mouseflow and FullStory depending on your requirements. Microsoft Clarity is free and suitable for many projects. More advanced platforms provide deeper segmentation and integration capabilities.
Will heatmapping tools slow down our website?
Modern behaviour analytics tools are lightweight and load asynchronously. Hotjar and Microsoft Clarity add minimal page load overhead, typically under 50ms. We test page speed before and after installation to confirm there's no measurable performance impact.
What types of user behaviour insights can be uncovered?
For a typical audit, we review 200-500 session recordings per key page or funnel step. For ongoing programmes, we review sessions weekly, focusing on specific pages, new features or areas where analytics data flags unusual behaviour. Automated rage-click and error detection prioritises the most informative sessions.
Is session recording GDPR compliant?
Yes, when configured correctly. We ensure all recordings comply with GDPR and the UK Data Protection Act 2018. Personal data such as form inputs, passwords and payment details are automatically masked. Cookie consent banners are configured to request appropriate permissions before recording begins.
How quickly can you set up heatmapping on our site?
Tool installation typically takes 1-2 hours. We install the tracking script, configure privacy settings, set up page-specific recording rules and verify data collection. Meaningful data starts accumulating within 48-72 hours of installation depending on traffic volume.
Can you analyse mobile and desktop behaviour separately?
Absolutely. Mobile and desktop users behave very differently. Tap patterns, scroll depth and navigation behaviour vary significantly between devices. We always segment analysis by device type and often produce separate recommendation lists for mobile and desktop experiences.
What is a rage click?
A rage click is when a user clicks the same area rapidly in frustration, typically because an element appears interactive but doesn't respond, or because a page is loading too slowly. Rage click detection automatically identifies these frustration moments so we can investigate and fix the underlying cause.
What is a rage click and what does it tell us about user frustration?
Heatmaps reveal whether visitors engage with key content sections, internal links and CTAs. If users consistently scroll past important content or ignore internal navigation links, it affects both conversion rates and the effectiveness of your SEO services. Understanding scroll behaviour helps optimise content structure for both users and search engines.
Is this type of analysis useful for mobile-first websites?
No. Heatmapping tools can only be installed on websites you own or control. However, we can analyse your own pages against competitor benchmarks using publicly available conversion rate and engagement data to identify where your UX falls behind industry standards.
FROM THE BLOG
Our Latest Digital Agency Insights

What Is DLSS 5? AI Generated Art, Neural Rendering & When AI Overrides the Artist
What is DLSS 5 and why are game artists furious? We break down neural rendering, the AI generated art controversy, and the AI bias problem.

ChatGPT vs Gemini vs Bing: The Best AI Search Engines and What Comes Next
Compare the best AI search engines of 2026, including ChatGPT, Gemini, Perplexity and Copilot. How AI Overviews and GEO are changing search.

What Is AGI (Artificial General Intelligence) or True AI? AI vs AGI vs ASI Explained
What is AGI and how does it differ from the AI we use today? We explain ANI vs AGI vs ASI, where GPT-5 fits, and when experts predict AGI will arrive.
Get in Touch
Interested in Working with Us?
We have 100% happy customers, so don't delay. Get in touch today and see how we can help.
SEND US A MESSAGE